
Event planners, production designers, and high-end studios face an identical post-event hurdle: proving experiential impact with hard data. For decades, the success of a multi-day wedding or large-scale corporate summit was evaluated using anecdotal sentiment—a passing compliment from the host, a subjective review, or an informal text message.
High-budget productions demand quantitative proof. Modern production teams increasingly rely on event gallery user analytics to translate attendee engagement into measurable client ROI. By analyzing how attendees interact with visual media in real time, organizers transform digital photo delivery from a passive storage archive into an operational feedback engine.
The Blind Spot in Event Production: Why Post-Event Feedback Is Outdated
Traditional post-event evaluation workflows are fundamentally broken. Relying on post-hoc surveys introduces severe friction and skewed data that fail to reflect authentic attendee sentiment.
The Failure Rate of Post-Event Surveys
Standard feedback forms sent 48 to 72 hours after an event suffer from predictable failure modes:
- Survey fatigue: Typical guest survey completion rates drop below 8% to 12%, capturing only extreme viewpoints.
- Recall degradation: By the time a survey link lands in an inbox, the emotional resonance of the occasion has dissipated.
- Response bias: Unhappy attendees complain, and hyper-enthusiastic family members flatter, completely erasing the median guest experience.
Behavioral Telemetry vs. Explicit Feedback
What guests do with event media reveals far more than what they write in a comment box. Digital interaction telemetry tracks non-verbal, unsolicited engagement:
- Did an attendee search for their portrait immediately after a keynote or Sangeet?
- How many individual images did they preview before initiating a high-resolution export?
- Did they share assets instantly to external channels, or did they bounce immediately?
Measuring direct behavioral signals eliminates survey friction and replaces guesswork with unvarnished behavioral data.
Core Metrics of Event Gallery User Analytics
To evaluate guest sentiment accurately, modern organizers track interaction telemetry across the visual delivery lifecycle.
Dwell Time and Gallery Session Length
Passive visitors rarely spend more than 30 seconds browsing generic photo dumps. Longer dwell times directly correlate with higher perceived event value. Tracking average session duration across specific segments (e.g., morning rituals, formal dinner, main stage performances) reveals which event milestones resonated most with attendees.
Asset Engagement Velocity
Asset velocity measures the speed and volume of photo interactions per minute. A sudden spike in gallery queries within 15 minutes of a headline act or couple's grand entrance indicates high emotional resonance and peak engagement. Tracking these timestamps provides production teams with precise temporal data on show pacing and crowd response.
Heatmapping Guest Interaction by Category and Album
Rather than treating an event as a monolithic folder, segmenting telemetry by sub-albums (e.g., Decor, Culinary Presentation, Stage Lighting, Candid Portraits) identifies which creative investments delivered the highest visual engagement.
Transforming Raw Gallery Data into Client ROI Reports
Data is only valuable if it clarifies business outcomes. For corporate producers and luxury wedding agencies, translating interaction metrics into clean debriefs justifies production budgets and accelerates contract renewals.
Building Executive-Ready Debriefs
Presenting corporate sponsors or luxury wedding couples with structured analytics transforms the standard post-event wrap-up:
- For corporate sponsors: Replace soft estimates with validated attendee view counts, brand impression durations, and asset export volumes.
- For private clients: Provide couples with a visual engagement summary showing total guest reach, collective viewing hours, and the most celebrated moments of their multi-day celebration.
Key Performance Indicators (KPIs) Event Organizers Need to Present
- Gallery Adoption Rate: Percentage of total verified attendees who accessed the digital environment.
- Download-to-View Ratio: Indicator of asset quality, relevance, and individual satisfaction.
- Amplification Velocity: How rapidly attendees converted private gallery links into external social broadcasts.
Technical Conversion: How to Track Guest Image Download Funnels
Understanding overall views is insufficient; production teams must track guest image download funnel drop-offs to optimize digital delivery.
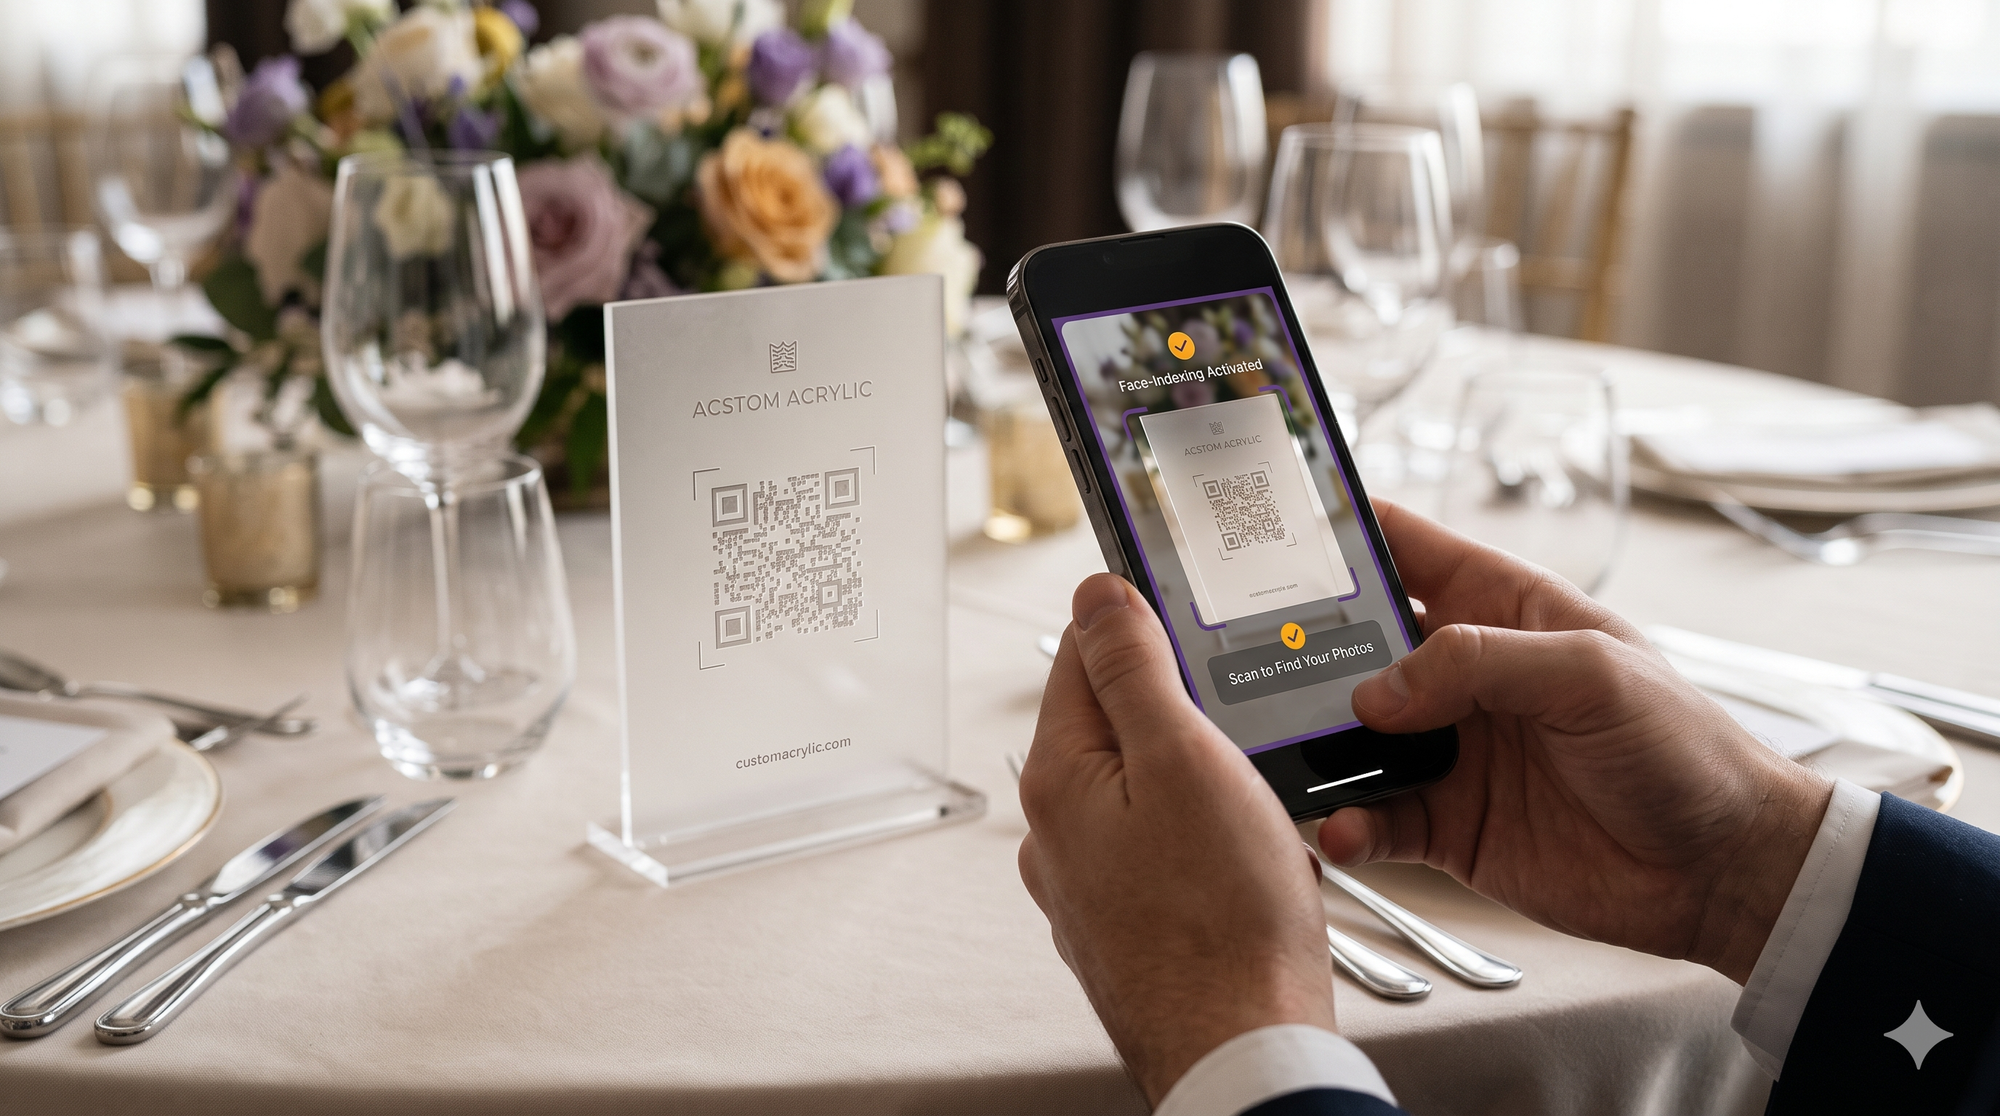
- Top of Funnel (Discovery): On-site signage scans, printed table cards, or broadcast messaging links.
- Middle of Funnel (Indexing): Using biometric search or keyword tags to filter thousands of images down to individual portraits.
- Bottom of Funnel (Conversion): Successfully executing high-resolution downloads to local mobile storage.
System bottlenecks—such as forced account registrations or bloated ZIP extractions—destroy conversion rates. Analyzing each phase of the download pipeline allows teams to remove friction and preserve attendee engagement.
Amplification and Real Guest Satisfaction
Beyond internal viewing, how guests handle media reveals their advocacy level. Evaluating external reach requires systems designed to measure social amplification events at scale.
Traditional event hashtags routinely fail to capture real reach because private profile settings block aggregation tools. Tracking direct platform exports (e.g., immediate shares to Instagram Stories, WhatsApp, or LinkedIn) provides a reliable metric of true earned media value without depending on public tagging.
Similarly, relying solely on public review platforms skews operational visibility. Modern event vendors use specialized client net promoter score tools embedded directly within the delivery flow. Prompting micro-feedback at the precise psychological peak—when an attendee views and downloads an exceptional, polished portrait of themselves—yields response rates 5x higher than post-event emails.
Competitive Advantage: Kamero vs. Legacy Gallery Platforms
Traditional client galleries were engineered as passive digital storage lockers, not real-time telemetry hubs.
The Competitor Gap
Legacy gallery hosts leave production teams completely data-blind while an event unfolds. If link delivery fails or navigation proves confusing, organizers only find out days later through client complaints.
Kam-Sync & Real-Time Telemetry
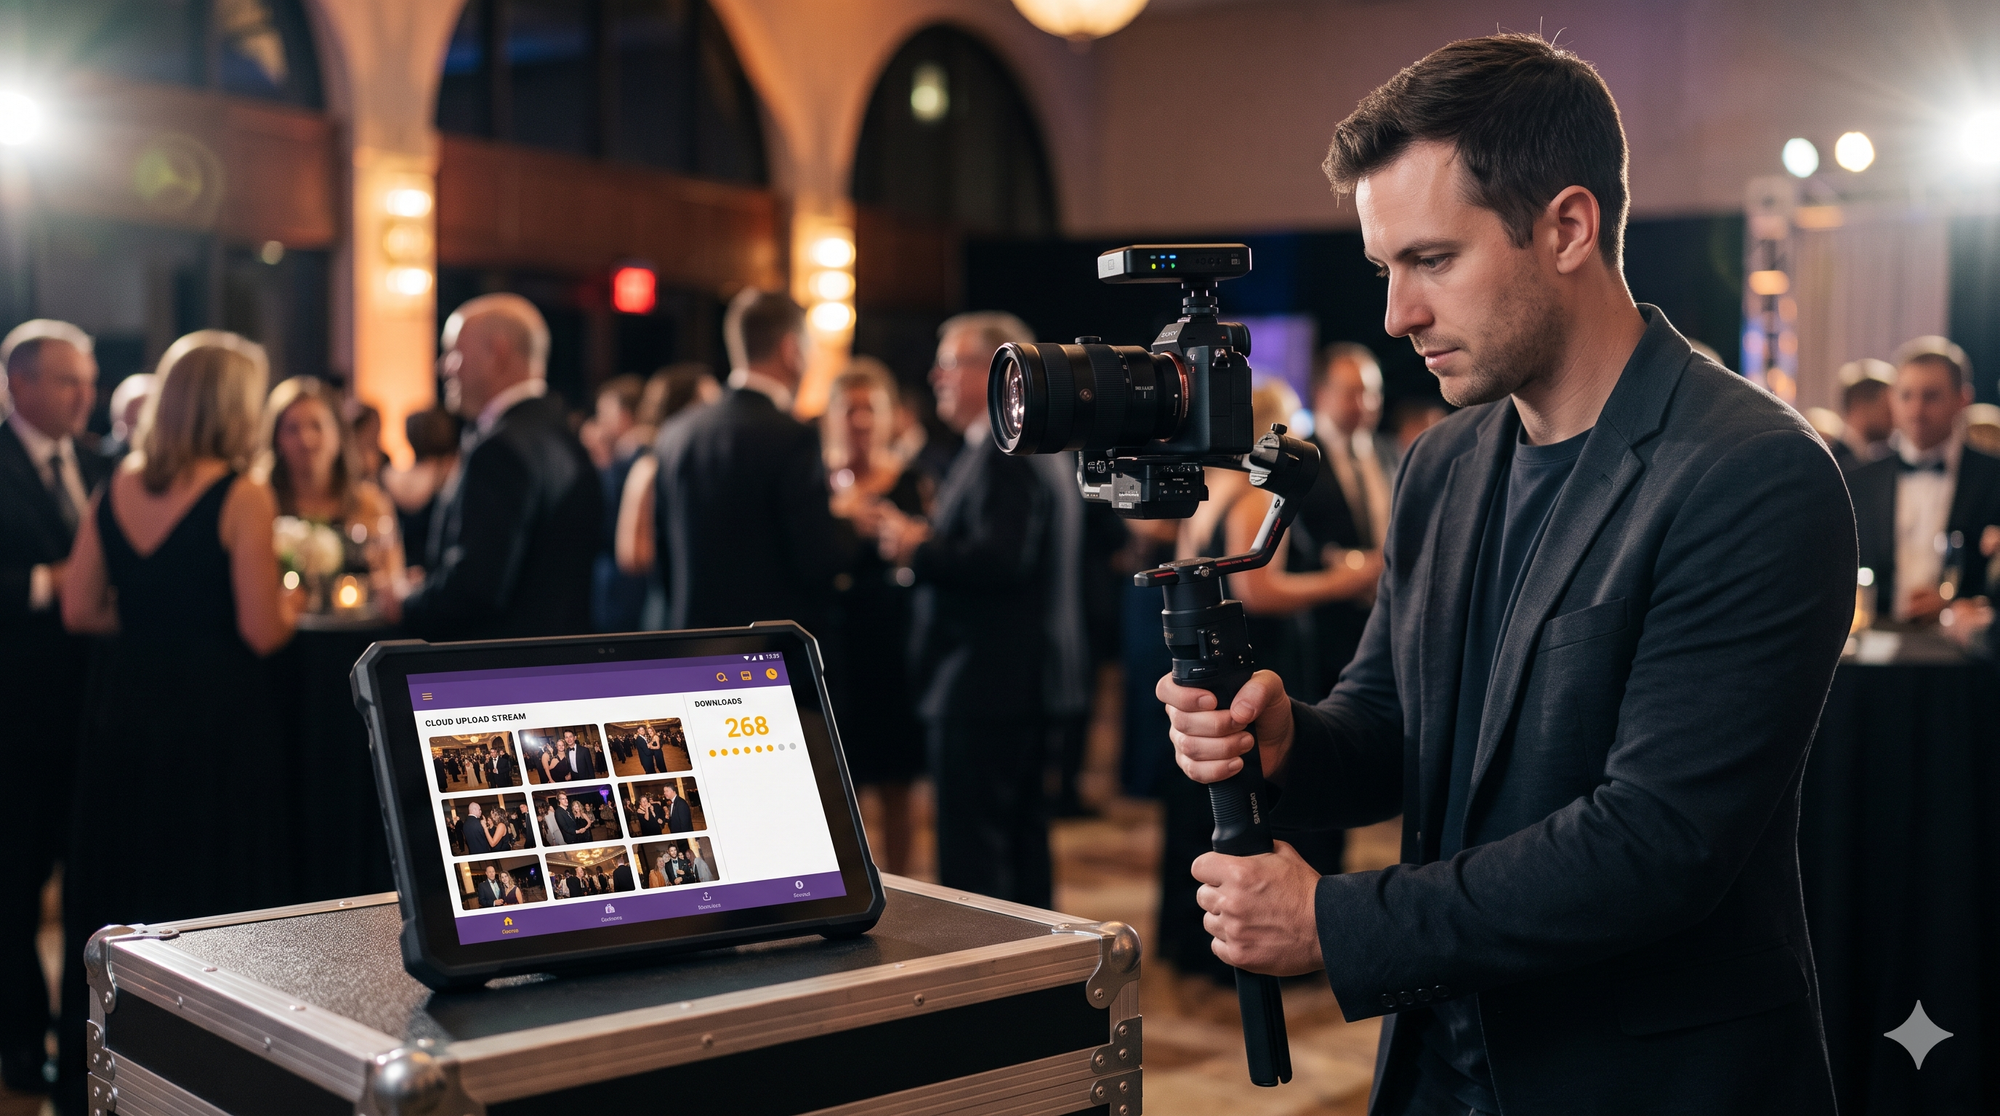
Kamero’s Kam-Sync technology bridges the camera-to-cloud gap. As photographers capture key moments, optimized files upload directly to indexed live galleries. Production teams monitor asset consumption, search volume, and download velocity directly from a unified live dashboard while the event is active.
White-Label Data Governance
Client relationships belong to the agency, not third-party SaaS vendors. Kamero provides comprehensive white-label native applications and portals, allowing event brands to deliver sophisticated telemetry, guest matching, and media access under their own corporate identity without external watermarks.
4 Actionable Steps to Implement Gallery Analytics at Your Next Production
- Standardize On-Site Entry Touchpoints: Replace static URL links with dynamic, scannable QR codes positioned at registration desks, media walls, and table settings.
- Eliminate Download Authentication Walls: Strip away forced account creations, social passwords, or software installations to maximize top-of-funnel conversion.
- Automate Real-Time Ingestion: Deploy camera-to-cloud syncing during high-impact moments so guests interact with professional media while emotional momentum is peak.
- Export Structured Client Scorecards: Collate dwell times, download rates, and amplification numbers into your standard post-event wrap-up deck to substantiate production ROI.
Frequently Asked Questions
What privacy standards govern facial recognition in event gallery analytics?
Modern platforms like Kamero use localized biometric vector mapping rather than persistent public identity databases. Face embeddings are generated exclusively within the context of the specific event gallery to index images, and they are never cross-referenced with external surveillance systems or commercial profiling databases.
Can gallery analytics track downloads across private social sharing?
Direct gallery telemetry tracks exports initiated from the platform interface—such as direct shares to WhatsApp, Instagram, or local device storage. Once an asset is saved locally, downstream reach is evaluated using aggregated impressions and link-click parameters rather than intrusive device tracking.
How does camera-to-cloud latency affect gallery engagement metrics?
Real-time delivery dramatically shifts engagement curves. Galleries populated within 60 to 90 seconds of a live moment see an average engagement lift of over 300% compared to galleries delivered 48 hours later, driven by on-site excitement and real-time social sharing.
Upgrade Your Event Telemetry
Stop managing blind photo distribution. Turn your event galleries into an actionable data engine that proves experiential ROI, accelerates client referrals, and elevates your production standard.
Book a Kamero Demo Today to experience real-time sync and live gallery analytics, or Sign Up for a Free Trial to transform your next event setup. Keep up with modern event workflows by Following Kamero on Instagram.
About Pavani Nagar
Hey there! Pavani Nagar, a Digital Marketing Manager who enjoys working on content, social media, and figuring out what makes people pay attention. I like trying new ideas, learning along the way, and keeping things simple.